What cosine similarity actually means

Michael Davis7 min read


Cosine similarity is a score for how close two pieces of text are in meaning. An embedding model turns each page, passage, or query into a long list of numbers. Cosine similarity then compares the direction of those two lists, not how long they are and not how many exact words they share.
If that sounds more like a geometry problem than an SEO metric, it is. The score only showed up in audits because retrieval systems started using it, and SEO tools started exposing the same number.
What cosine similarity is
Cosine similarity compares the direction of two vectors. In semantic SEO, those vectors are embeddings: numerical representations of a query, a passage, or a whole page. Texts the model treats as similar point in similar directions. Texts it treats as different point farther apart.
The mathematical scale runs from -1 to 1:
- 1means the vectors point in the same direction.
- 0means they sit at right angles.
- -1means they point in opposite directions.
Those are geometric descriptions, not ready-made labels for "same topic," "unrelated," and "opposite topic." In many text embedding models, ordinary web content occupies a much narrower part of the possible space. Negative scores may be rare. Scores near zero may be rarer still.
The first trap is treating the full scale as if an SEO team can use it like a percentage. The useful range for a particular model and collection of pages is often squeezed into a small band near the top.
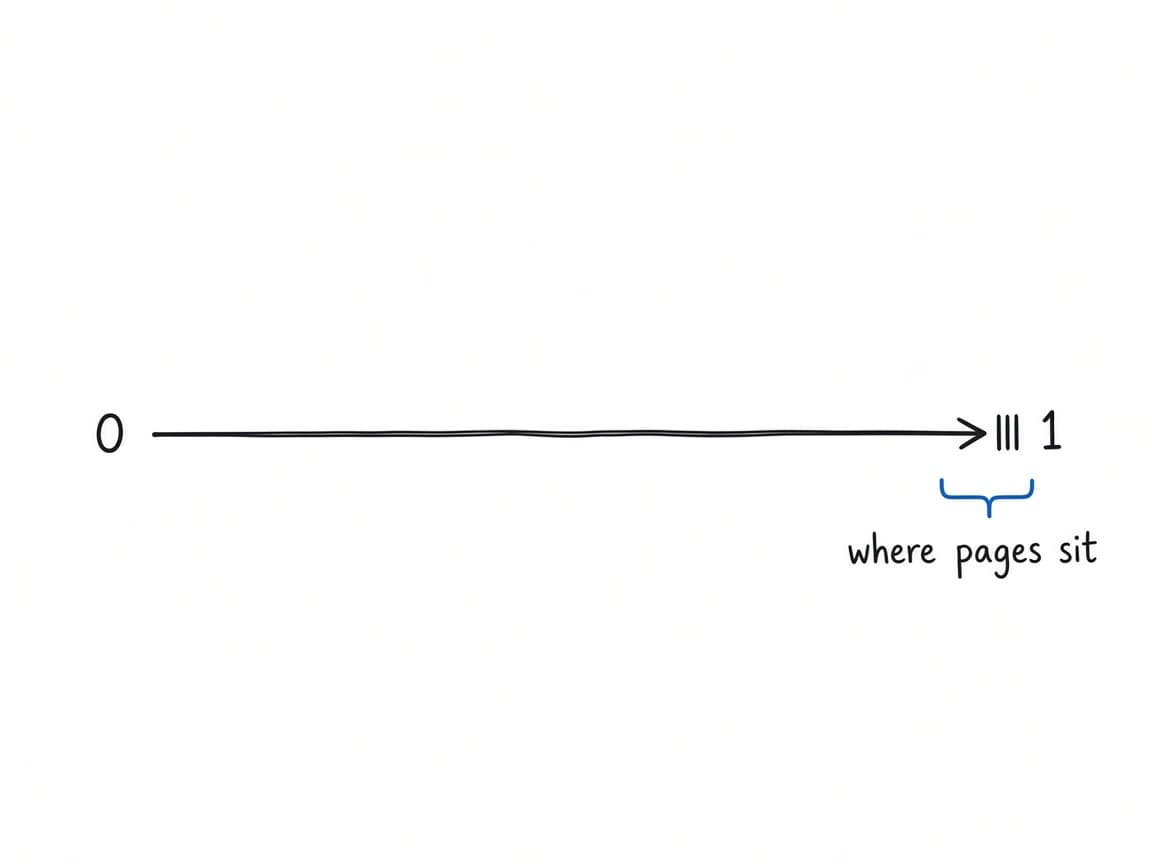
The line goes all the way to zero. The pages do not. That is why 0.85 can look huge as a percentage and still be ordinary on a site.
In plain terms
Think of two arrows. If they point the same way, the model sees the texts as similar. If they point in different directions, it doesn't. Cosine similarity is just the number for how aligned those arrows are.
It is not a grade, and it is not "percent the same." A score of 0.85 does not mean one page is 85% like the other. It means the two pieces of text ended up pointing in a similar direction after a model turned them into numbers.
How close is "close" still depends on the model and the rest of the site. That is the part the rest of this post is about.
Why cosine similarity showed up in SEO
SEOs used to compare pages with shared words: keyword overlap, TF-IDF, maybe a Jaccard score if someone was feeling ambitious. That works when two pages use the same terms. It misses the common case where a page answers the same question in different language.
Embeddings closed that gap. Once a crawl can turn pages into vectors, cosine similarity is a cheap way to ask "which pages are talking about the same thing?" without requiring the same phrasing. Semantic SEO tools started using it to cluster a site, flag overlapping content, and rank passages against a query.
The other reason it got popular is less about SEO tools and more about how answer engines retrieve content. Retrieval-augmented systems usually do not start by counting keywords. They embed the question, embed the passages they might use, and pull the ones pointing in the closest direction. Cosine similarity is often the ranking step underneath that.
So the score is not a new ranking factor someone invented for dashboards. It is a measurement from the retrieval stack that SEOs now see in audits, content maps, and "related page" reports. That is useful. It is also easy to overread.
A cosine similarity score of 0.85 looks reassuringly precise. On one 105-page software site we measured, randomly paired pages averaged about 0.82. Pages with little in common beyond sharing a domain routinely reached 0.85. That is not "85% similar." It barely cleared the site's background hum.
Unrelated pages can share a high baseline
Pages from the same site have plenty in common before topic enters the picture. They use the same language, brand vocabulary, writing style, and recurring product terms. Depending on what gets extracted, they may also share navigation, footer copy, and template text.
An embedding can capture some of that shared context alongside the subject of the page.
We saw the effect on a 105-page crawl. Randomly selected page pairs averaged around 0.82. A privacy policy and a product page could reach 0.85 even though no SEO would describe them as topically close. On that crawl, the rough bands looked like this:
| Comparison | Score we observed | What it suggested |
|---|---|---|
| Random page pairs | About 0.82 on average | The site's background baseline |
| Genuinely related pages | Around 0.86 and above | A topical relationship worth inspecting |
| Near-duplicate pages | Above 0.95 | Very similar content |
These are observations from one site under one model, not thresholds to paste into an audit template. Another site, extraction method, or embedding model could move every number.
The useful signal was the distance above the baseline. A score of 0.87 looked only two points better than 0.85 when treated like a percentage. Against a site baseline near 0.82, that small-looking gap carried much more information.
Query scores live in a different neighborhood
A similarity score also changes meaning based on what is being compared. Page-to-page similarity asks whether two substantial documents point in a similar direction. Query-to-page similarity asks whether a short question aligns with a much longer passage or page.
Many retrieval models are trained or prompted to handle those two inputs differently. Even when the final calculation is still cosine similarity, the resulting scores do not necessarily occupy the same range.
On the same software-site crawl, we tested an intentionally irrelevant query: pizza recipes. Its best page match still scored 0.46. Queries that were genuinely relevant to the site topped out between 0.56 and 0.72.
That creates a slightly strange but important comparison:
0.60 for a query and page
could be a useful retrieval match.
0.60 for two pages
sat well below the page-pair range we observed.
Same metric. Same crawl. Very different context.
This is why a universal rule like "anything above 0.75 is related" falls apart quickly. Change the comparison type and the rule stops working. Change the model and it may stop working again.
Read the distribution before reading the score
A cosine score makes more sense as a sensor reading than a grade. A thermometer showing 72 is precise, but not very helpful until you know whether it is using Fahrenheit or Celsius.
For similarity scores, three checks provide that missing context:
01Find the noise floor.
Compare pages or queries you know are unrelated. Their scores show where the collection's background similarity sits.
02Look at the spread.
A top result at 0.68 is interesting when the median result is 0.50. A top result at 0.60 is less convincing when every other result sits at 0.59.
03Use known-good anchors.
Read a few matches and mark the ones that are clearly right. The point where those separate from plausible-but-wrong results is more useful than a threshold borrowed from another site.
For retrieval, relative position often matters more than the raw value. The system is choosing among the available passages, not waiting for one of them to cross a universal 80% line. A weak "top result" can still win when everything else is worse.
That last case is easy to miss. A ranked list always has a number one result. It does not always have a good result.
Raw scores are awkward, but percentages are worse
We show raw cosine scores in semantic search because turning 0.85 into "85% similar" adds confidence the measurement has not earned. The raw value leaves the calibration work visible: compare it with the site's distribution, the rest of the result set, and examples an SEO has checked by hand.
The same caution applies when using similarity to build a semantic map of a site. A high-scoring pair is a prompt to inspect the pages, not automatic evidence that one needs to be consolidated. Closely related pages can serve different intents. Near-duplicates can also hide behind small template differences.
We are still working through the friendliest way to label these ranges without implying they travel cleanly between models and sites. For now, the raw score plus a visible distribution is the least misleading answer we've found.
Put crawl evidence to work
Download Silkra and turn audits, briefs, and fixes into one focused workflow.
Get started Jira
Jira Linear